
Key metrics in the hair salon show whether a busy salon is also a financially healthy one. What matters here is not only how much revenue is generated, but also how that revenue is created. Just as important are the costs behind it and how much remains at the end for reserves, investment and owner compensation.
The following seven metrics in the hair salon provide a practical foundation. They do not replace an individual financial analysis, but they help identify developments early and support better decisions.
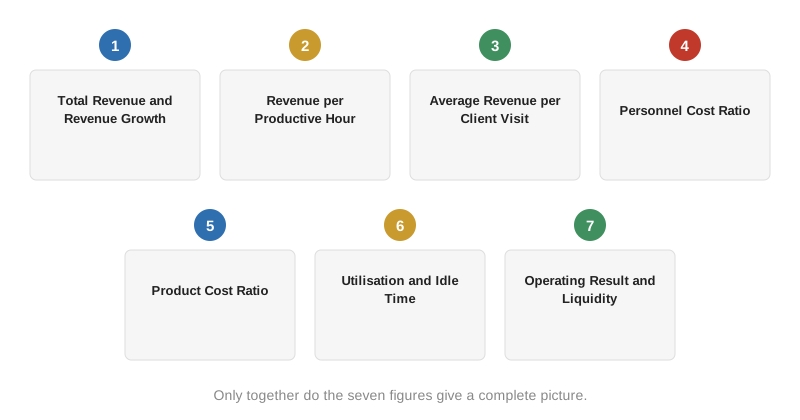
1. Key metrics in the hair salon: total revenue and revenue development
Monthly revenue first shows the scale of the business. It only becomes meaningful, however, when compared with the previous month, the same month in the previous year and the planned target. Seasonal fluctuations should also be considered.
The key question here is not only how high revenue was. Just as important is the question of why it changed. Possible reasons include customer volume, price changes, team size, absence or a different utilisation level.
2. Revenue per productive working hour
This metric connects service revenue with the time actually spent serving clients. It thereby shows whether prices, treatment times and appointment planning work together economically.
A low value can indicate prices that are too low, treatment times that are too long, excessive idle time or an unfavourable service mix. Before judging individual employees, it helps to first review the operating conditions.
3. Average revenue per client visit
The average ticket shows how much revenue is generated per visit. It is influenced by the scope of services, pricing, additional treatments and retail sales.
A useful analysis separates customer groups and service types. A rising average ticket is positive when it results from appropriate services and transparent pricing. It is a less positive sign, however, when visit frequency or client satisfaction declines at the same time.
4. Personnel cost ratio
The personnel cost ratio compares all personnel expenses with revenue. This includes not only gross wages, but also employer contributions, holidays, sickness, bonuses and other staff-related costs.
The figure should always be considered together with productivity, team structure and utilisation. A high ratio may, for example, indicate weak utilisation or unsuitable pricing. It can, however, also be temporary during onboarding, growth or a strategic staffing phase. How to correctly calculate your own personnel costs is covered in the article Personnel Costs and Wage Calculation in the Salon.
5. Product cost ratio
This ratio shows how much material is used in relation to revenue. Colour and treatment services in particular benefit from transparent tracking.
If the ratio increases, formulations, dosage, purchase prices, inventory and service calculations should be reviewed. The aim here is not to reduce quality, but rather to align material use and pricing transparently.
6. Utilisation and idle time
Utilisation describes the share of available productive time that is actually booked with clients. A full-looking calendar can be misleading, however: large time blocks may be reserved, or treatments are scheduled too generously. Uncounted cancellations can distort the picture as well.
7. Key metrics in the hair salon: operating result and liquidity
Revenue is not profit, and profit is not the same as available cash. The operating result shows whether the salon earns money after operating costs. Liquidity, in turn, shows whether wages, invoices, taxes and investments can be paid when due.
Both should be planned regularly. Reserves for taxes, repairs, seasonal fluctuations and investment are likewise part of stable business management. The article Liquidity Planning in the Salon explains how to plan liquidity in a targeted, forward-looking way.
Turning metrics in the hair salon into decisions
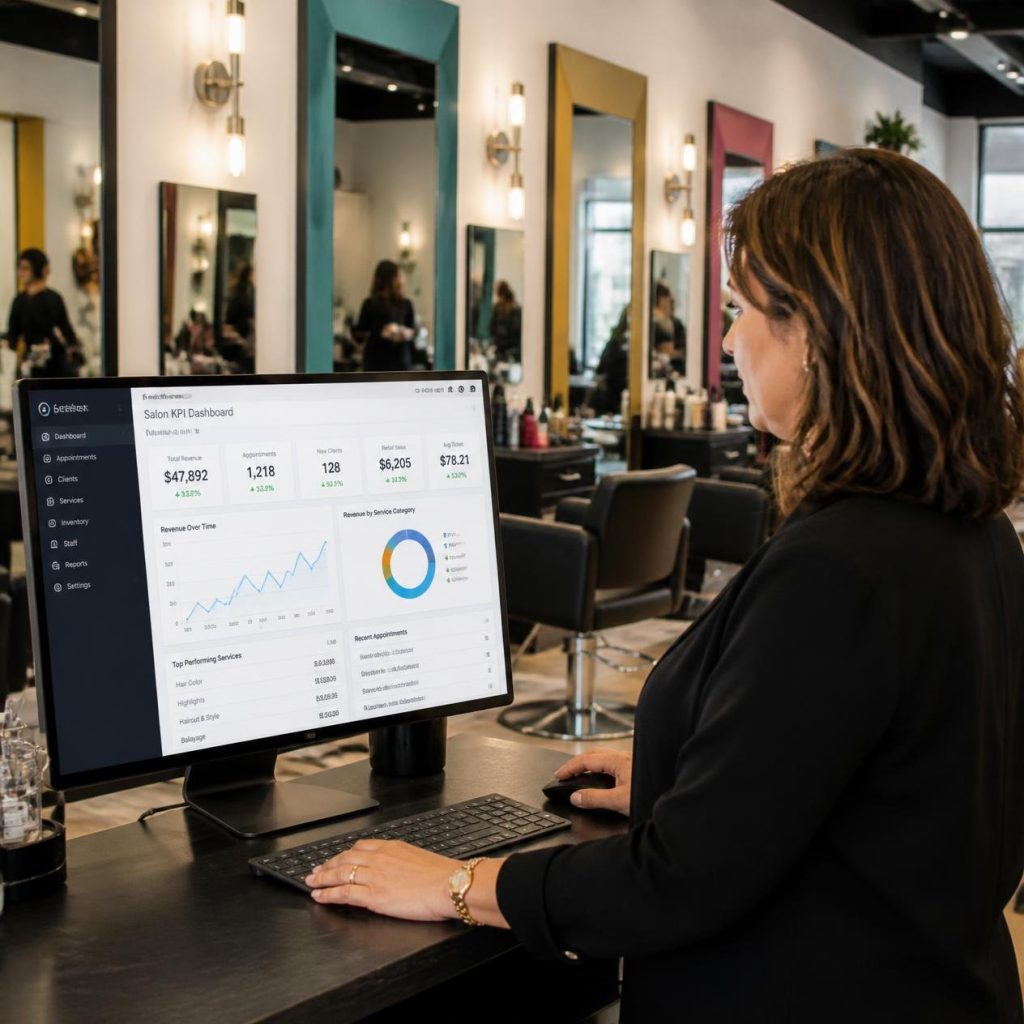
Metrics are not an end in themselves. They only become valuable when they lead to specific questions and actions:
- Which development differs from the plan?
- What is the most likely cause?
- Which factor can be influenced?
- Who takes responsibility?
- When will the effect be reviewed?
A monthly dashboard with a few, consistently maintained figures is usually more useful than a large report reviewed only occasionally.
For guidance on comparing these figures with other salons rather than tracking them only internally, see the article Benchmarking in the Salon. A neutral starting point for industry-wide comparisons is also provided by the branch benchmarks and operating comparisons published by the Chamber of Crafts Ostwestfalen-Lippe.
This article provides general information and does not replace individual legal, tax or financial advice.